Geostatistics explained
What is geostatistics?
Geostatistics estimates what lies between your measurements, and tells you how far to trust each estimate.
The idea in one observation
Geostatistics is the branch of statistics built for data spread across space. It starts from one plain observation: two samples taken close together are usually more alike than two taken far apart.
Every dataset with coordinates has that property to some degree, grades in an ore deposit, porosity in a reservoir, contaminant concentration in soil, biomass across a fishing ground.
Geostatistics measures how strongly it holds in your particular case, then uses that measurement twice: to estimate values where nobody sampled, and to quantify how uncertain each of those estimates is.
What makes it different from ordinary statistics
Ordinary statistics treats a set of measurements as a list of numbers. Order does not matter and position does not exist. That is fine for "what is the average?" but it cannot answer "what is the value at a point where nobody measured?"
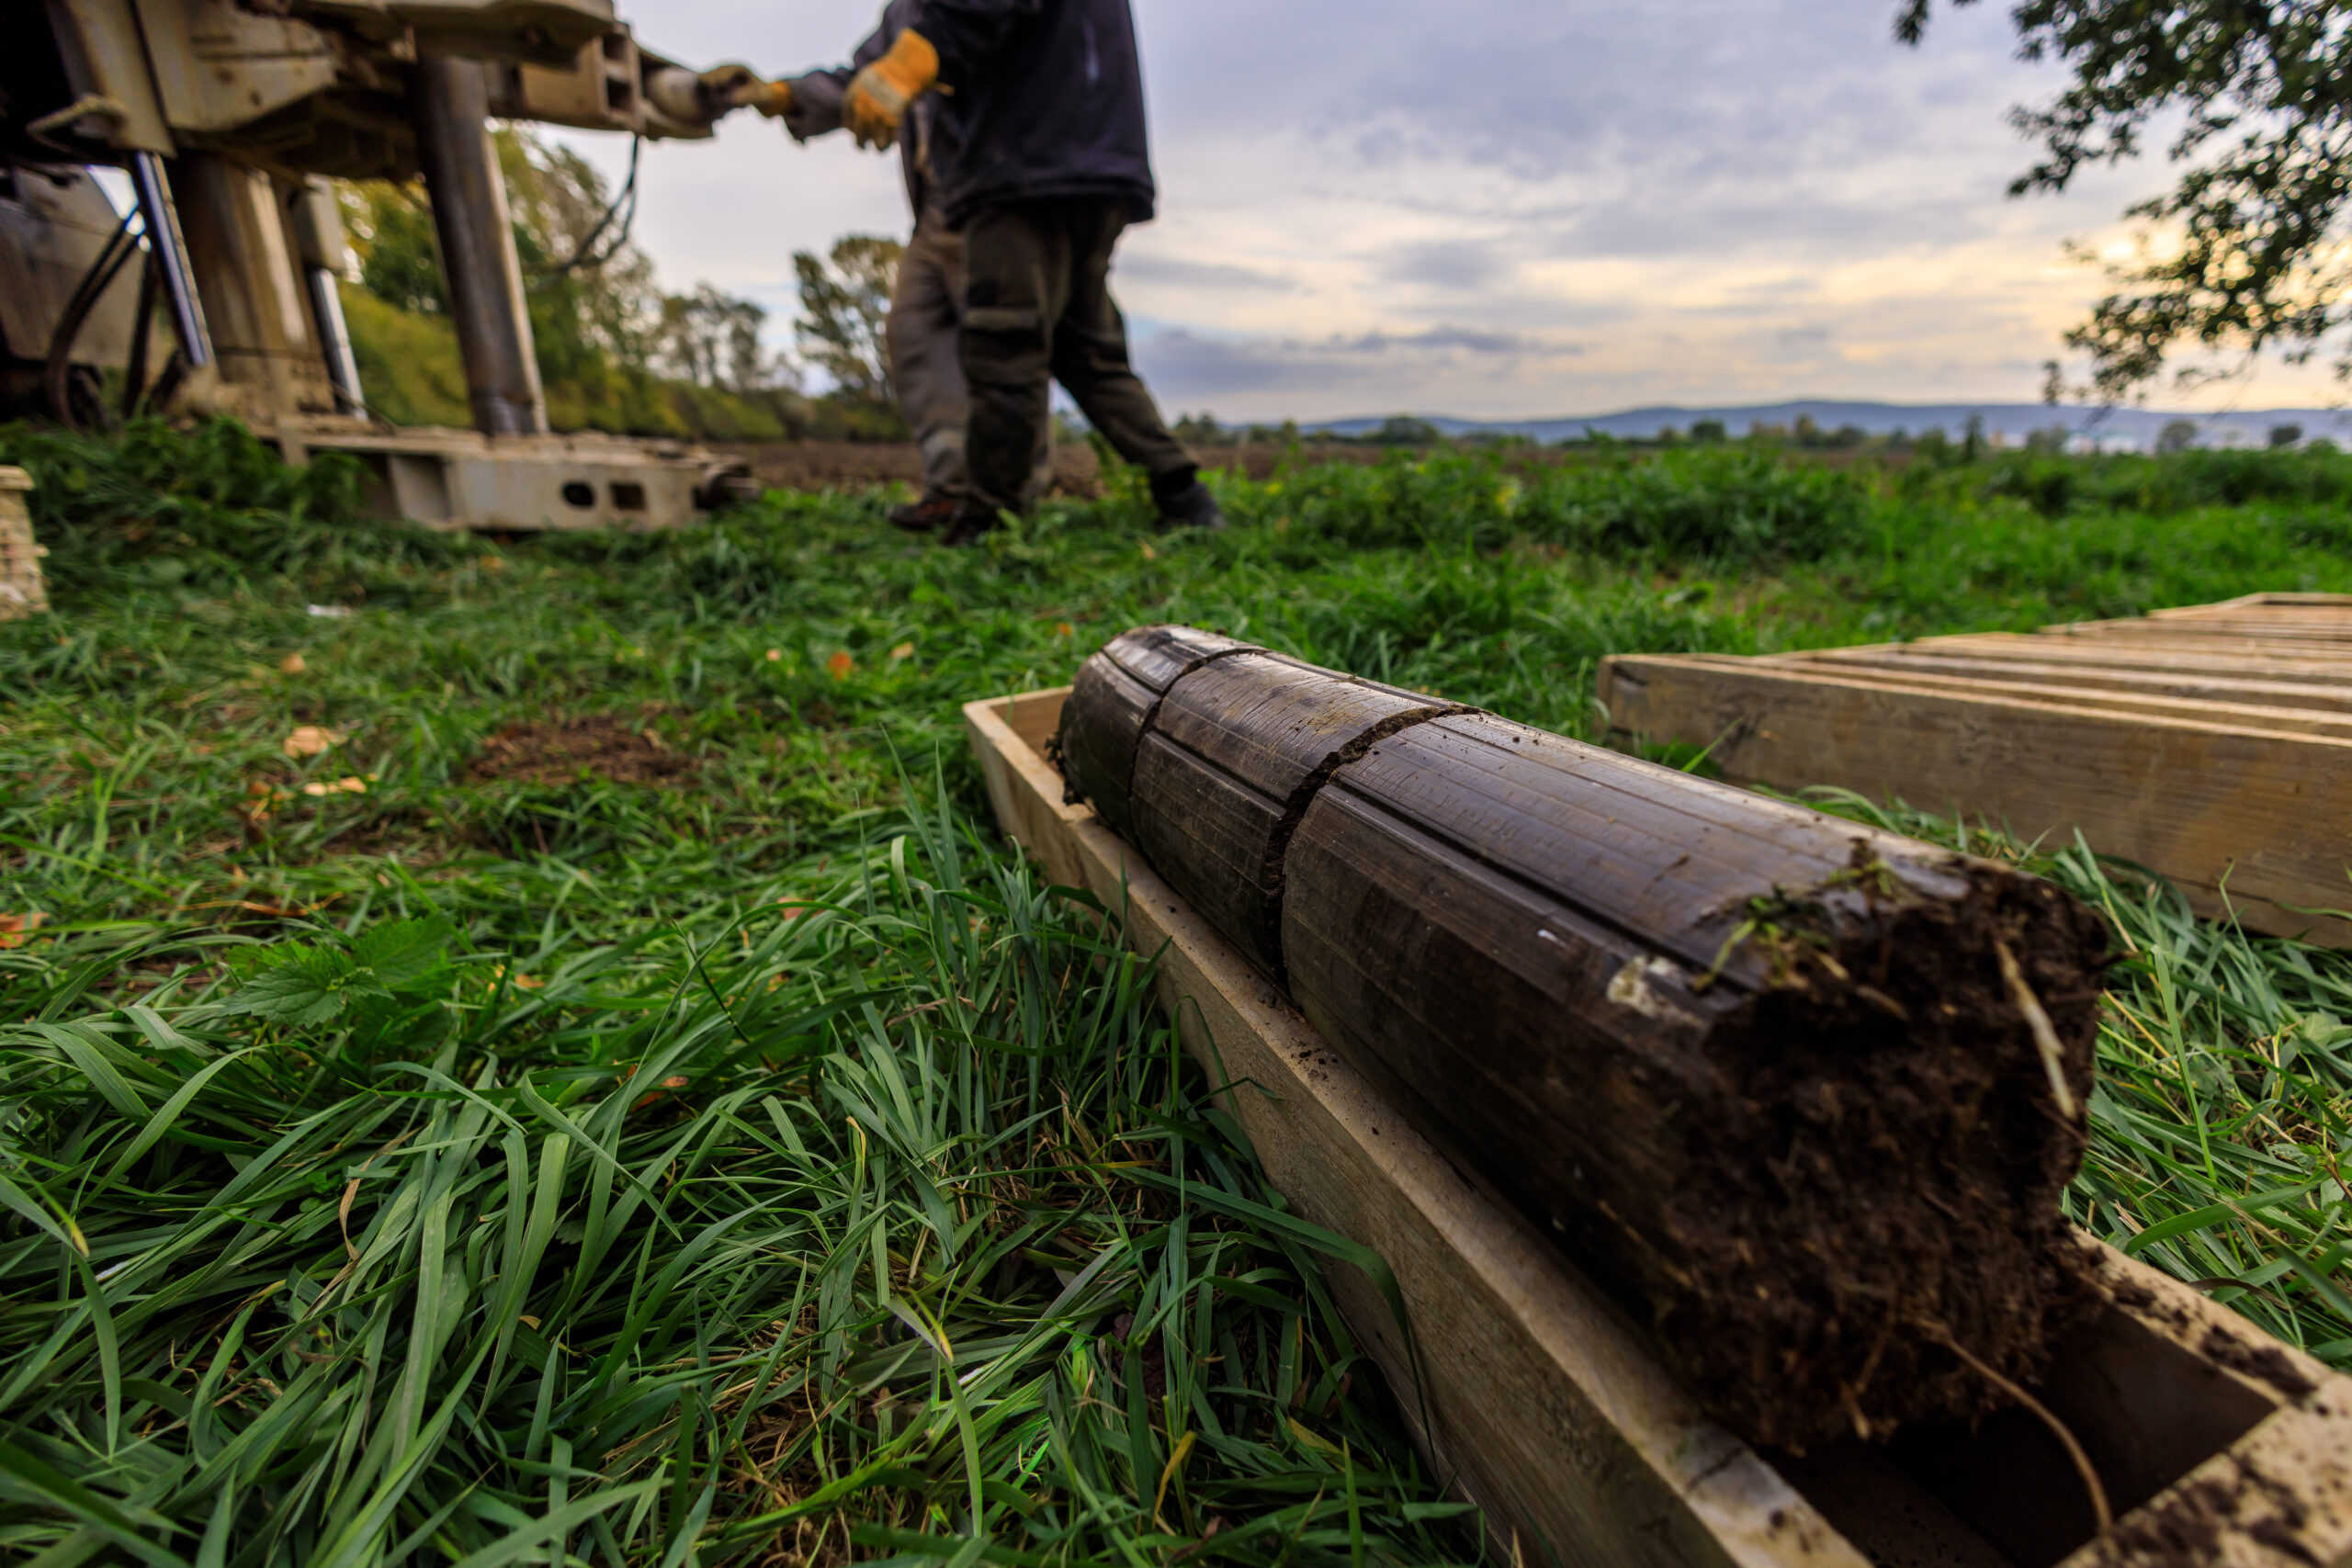
Geostatistics treats measurements as what they are: values attached to locations, taken from a body — rock, soil, water, seabed — that has structure. Modeling that structure is the whole discipline.
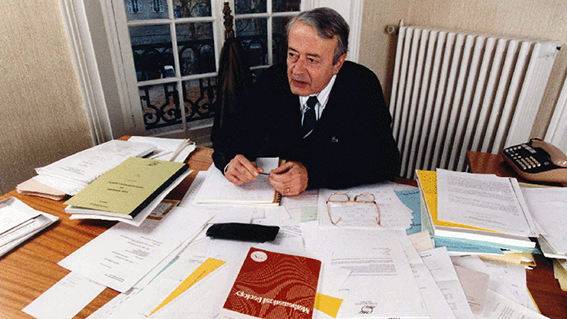
It was formalized by Georges Matheron (right image @MinesParis - PSL), who defined geostatistics as the application of probabilistic methods to regionalized variables: quantities whose value depends on where you measure them.
The practical consequence matters more than the definition. Because the model is built from your data's own spatial structure (modelized through the variogram), its predictions are shaped by how the variable actually behaves in space, not just by how many samples you have or where they happen to fall. Conventional interpolation methods, such as inverse distance weighting, nearest neighbor and polygonal estimation, work from geometry alone. They never ask how the variable behaves, because they have no way to measure it.
It also holds up regardless of how irregular the phenomenon is. Geostatistics does not require the thing you are modeling to be well behaved.
First, measure the structure: the variogram
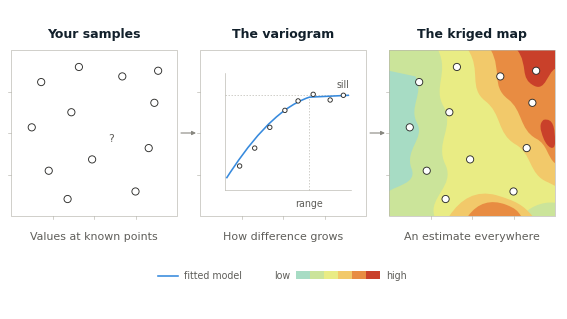
Nothing can be estimated until the spatial relationship has been measured. That is what a variogram does. It answers one question in numbers: how quickly does the similarity between two samples fall away as the distance between them grows?
Where continuity is strong, values stay related over long distances. Where the phenomenon is erratic, the relationship breaks down over distances of meters. The variogram captures that behavior, including its direction (continuity along one axis is rarely the same as continuity across it).
Every estimate and every simulation that follows rests on this one model. Get the variogram wrong and everything downstream inherits the error. It is the step that most rewards experience, and the first thing an auditor or independent reviewer will examine.
Then use it: kriging and simulation
Kriging trades realism for safety. Simulation trades safety for realism. Same variogram, opposite compromise, and they answer different questions.
grid_on The safe estimate: Kriging
Kriging maps the phenomenon between your sample locations. It uses the variogram to weight nearby samples according to how much information each one genuinely carries, then returns the most probable value at every point, along with a variance indicating how reliable that value is.
Kriging is deliberately cautious: it gives the best single answer the data supports and will not overstate it. Safety comes at a price. The kriged model is smoother than reality: highs come out lower, lows come out higher, the extremes flatten. When you need one defensible number, that smoothing is a feature. When the question depends on variability itself, it hides what you need to see.
layers The realistic picture: Conditional simulation
Simulation takes the opposite approach. Instead of one smoothed answer, it generates many equally probable versions of reality. Each one honors your actual sample values and reproduces the variability measured by the variogram, rather than averaging it away.
Realism comes at a price, too, and it is the mirror image of kriging: any single realization is a riskier estimate than the kriged model because it is a single possible outcome rather than the average of all outcomes. The value of simulation lies not in a single realization; it lies in the spread across all of them. That spread is what produces probabilities rather than point estimates.
Kriging and conditional simulation compared
| Criterion | Kriging | Conditional simulation |
|---|---|---|
| Answers | What is the value here? | What could the reality be? |
| Output | One model, one value per point | Many equally probable models |
| Against reality | Smoother than reality | Reproduces real variability |
| Trades | Realism for safety | Safety for realism |
| Confidence from | Kriging variance, point by point | The spread across realizations |
| Use it for | Mapping, a single defensible estimate | Risk, probability of exceeding a threshold, and decisions under uncertainty |
Which one, when
Use kriging when you need one defensible number.
Use simulation when you need the range — the probability that a volume exceeds a threshold, that a grade sits above cut-off, that contamination extends past a boundary.
Most serious work uses both: kriging for the estimate, simulation for the confidence around it.
Where geostatistics applies
Any time data are acquired and positioned in space (values with coordinates), a geostatistical approach is worth exploring. Because the range of domains is so wide and the questions so specific to each, a large family of methods exists.
Mining
EXPLORATION, OPERATION
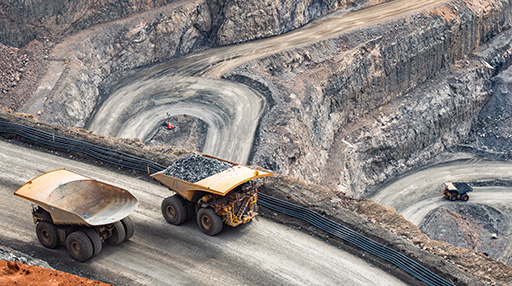
Estimating grades between drill holes, classifying resources, and quantifying the risk on tonnage above cut-off.
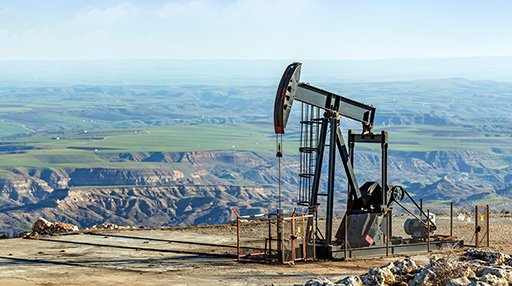
Energy
OIL, STORAGE, GEOTHERMAL
Mapping reservoir properties between wells and the uncertainty on volume and capacity estimates.
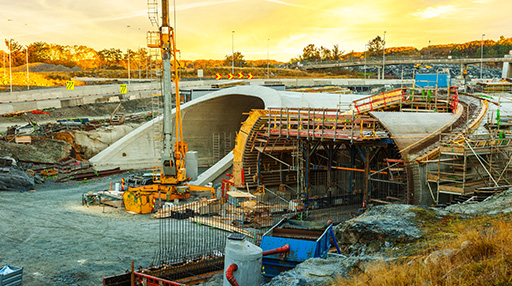
Subsurface characterization
GEOLOGY, HYDROGEOLOGY, GEOTECHNICS
Building ground and aquifer models from sparse boreholes, and assessing vulnerability to natural hazards.
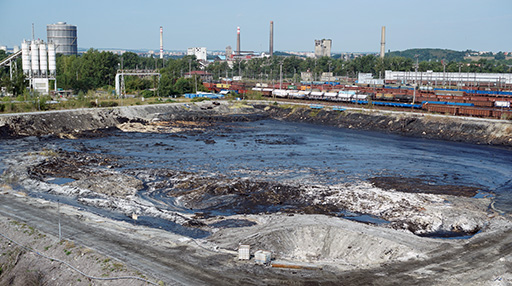
Environment
CONTAMINATED SOILS, NUCLEAR DECOMMISSIONING, AIR QUALITY
Mapping where concentrations exceed a regulatory threshold, and what that means for remediation volumes and population exposure.
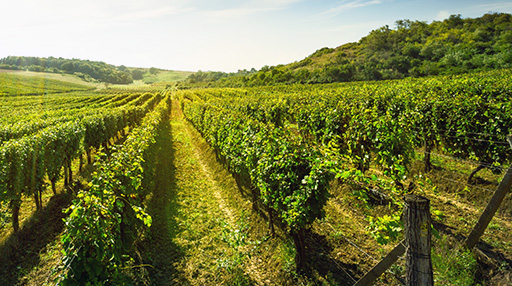
Bioresources
AGRICULTURE, FORESTRY, FISHING
Mapping variability across a field or a fishing ground, and estimating stocks or the health of a resource, with the confidence attached.
Any industry dealing with spatialized data
Beyond these five, geostatistics is applied wherever data carry coordinates — climatology, geochemistry, epidemiology, archaeology. Want to know more?
Let's talk about itFrequently asked questions
What is a variogram? expand_more
A variogram measures how quickly the similarity between two samples decreases as the distance between them increases, and how that varies with direction. It is the model of your data’s spatial structure, and both kriging and simulation derive their behavior from it, meaning that an error in the variogram propagates into every estimate and every downstream confidence interval.
What is kriging? expand_more
Kriging is a geostatistical estimation method that predicts the value of a variable at unsampled locations. It uses the variogram to weight surrounding samples according to how much information each carries, returns the most probable value at each point, and attaches an estimation variance showing how reliable that value is. Because it minimizes estimation variance, kriging produces a model that is smoother than reality, conservative by design.
What is conditional simulation, and how does it differ from kriging? expand_more
Kriging returns the most probable value at each location and minimizes estimation variance, thereby smoothing out natural variability. Conditional simulation generates many equally probable realizations instead, each honoring the sample values and reproducing the statistical properties of the data, so the variability is preserved rather than averaged away. The trade-off runs both ways: kriging gives up realism for safety, and any single simulated realization is a riskier estimate than the kriged one. Simulation’s value lies in the spread across all realizations, which is what risk quantification and decision-making under uncertainty require. In practice, the two are complementary.
Is geostatistics only for mining and oil and gas? expand_more
No. Geovariances works across five sectors: mining, energy, environment, subsurface characterization and bioresources — covering contaminated soil, nuclear decommissioning and air quality, hydrogeology and geotechnics, agriculture, forestry and fisheries. Beyond those, the same methods are applied in climatology, geochemistry, epidemiology and archaeology. Mining and energy are simply the longest-established areas, which is why most published examples come from them; the methods themselves are domain-independent.
Do we need a geostatistician on the team? expand_more
Not necessarily. Our consulting team works with organizations that have no in-house geostatistics capability and delivers the complete study, and equally with teams who have the expertise but not the time for a particular piece of work. If you would rather build the capability internally, our training programs are designed to do so.
What software do I need? expand_more
Isatis.neo is our reference platform, covering the full workflow from data QC through estimation and simulation to reporting, with a guided interface. Isatis.py brings the same algorithms into Python for scripting, automation, and integration into production pipelines. Kartotrak is dedicated to contaminated site characterization. All three implement the same underlying geostatistical methods.
Not sure which method fits your problem?
Tell us what you are trying to estimate and what decision depends on it. One of our geostatisticians will tell you straight whether geostatistics is the right tool, and which method to reach for.